
Global warming
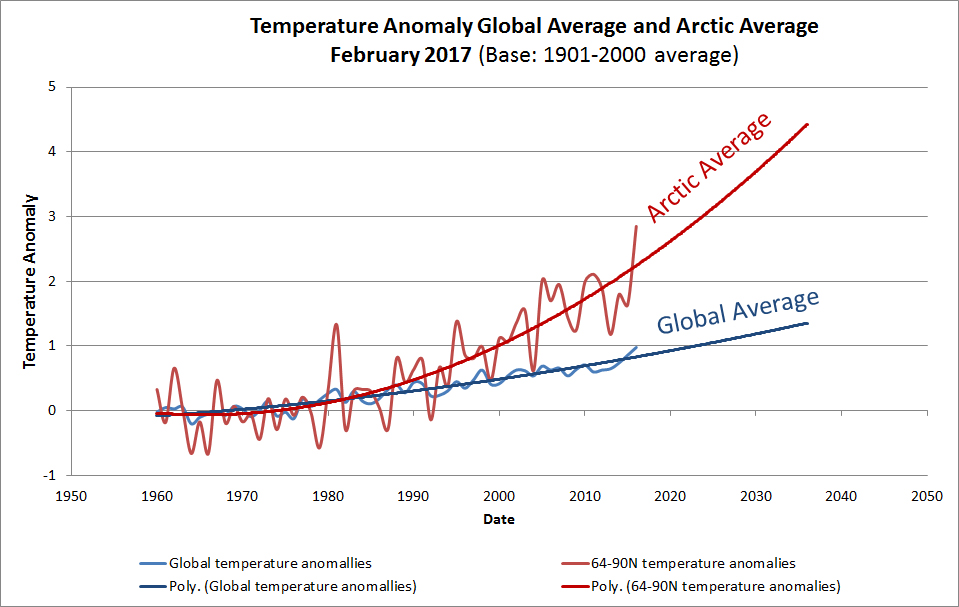
Global warming is not uniform everywhere. The Arctic and temperature regions warm faster than the tropics. It also takes time to happen. When you put a pot of water on the stove it does not instantly get hot. Well, the ocean is a huge pot of water and the "burner" is not all that hot, so it takes time. But once it gets hot it takes a very long time to cool down.
This little explanatory video is from Ben Henley (Research Fellow in Climate and Water Resources, University of Melbourne, University of Melbourne) and Nerilie Abram (ARC Future Fellow, Research School of Earth Sciences; Chief Investigator for the ARC Centre of Excellence for Climate Extremes, Australian National University).
Introduction
This section on human-caused global warming, sometimes called anthropogenic global warming (AGW), is presented in some detail. If you are interested in the whys and wherefores of global warming and the way the climate changes in response to the warming effect of greenhouse gases, this is a good place to get started. At the same time this is not intended to be a scientific treatise, although the information is scientifically correct. If you want to really dig in, you will need to go to the actual scientific literature.
Climate vs Weather
Weather is what you get, climate is what you expect
Climate is not the same as the weather. Instead, climate is the long-term annual norms for the weather. So the two are connected, but the weather is what is happening at any one time, whereas the climate is what is typical weather for any specific time of year. Climate change is reflected in the weather gradually getting a little warmer or a little cooler over many years.
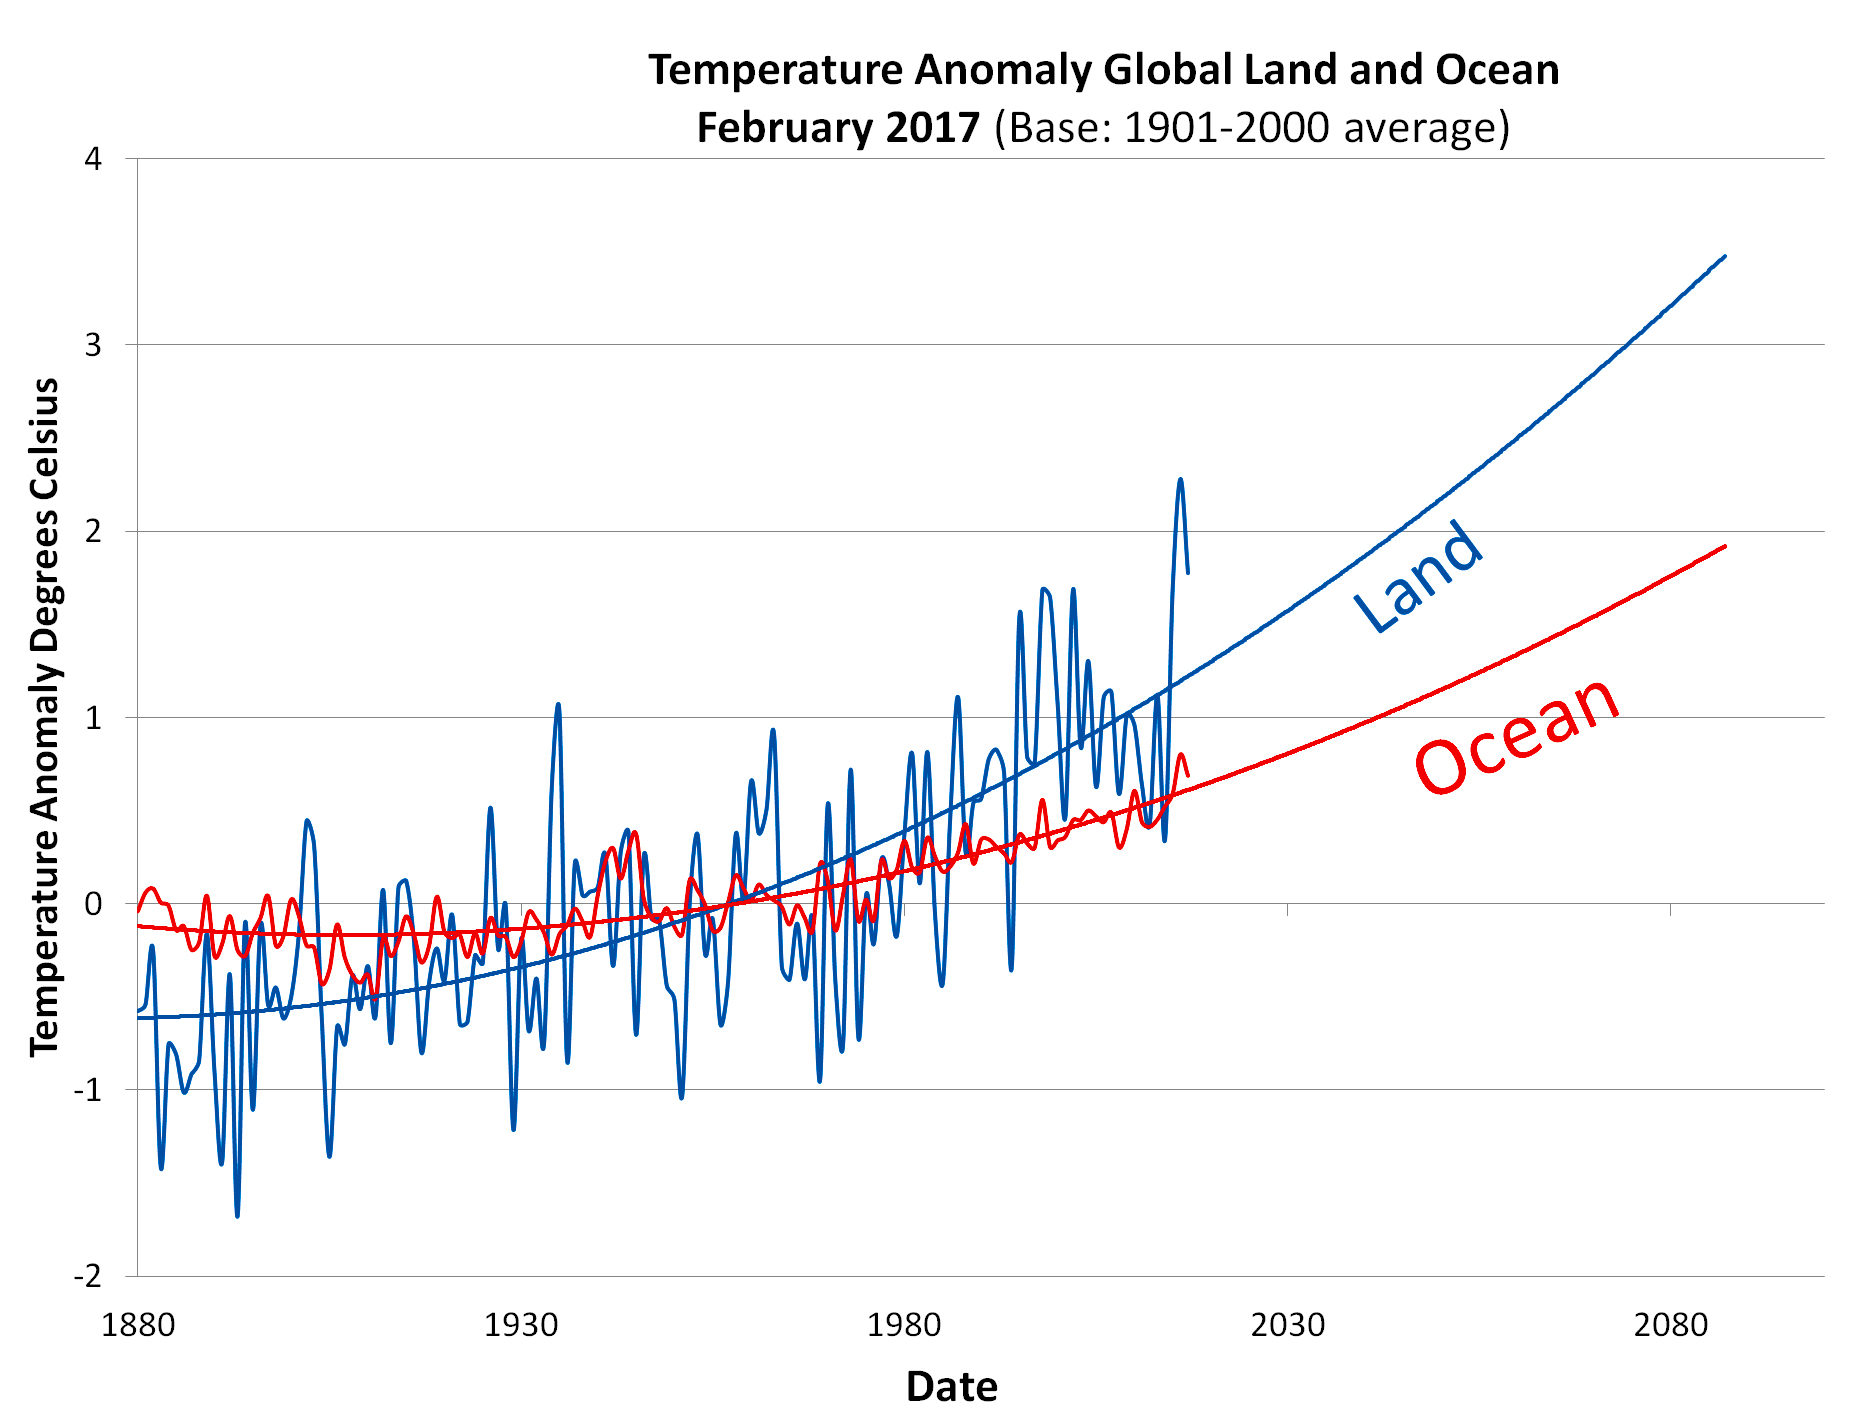
Global warming today is the trend toward warmer weather over a period of years. There may be some cool years but in the long term the trend is to warmer temperatures. The following graphs shows the trend-line (climate change) and the variations (weather). In each case the trend is predicted into the future so you can see where we are headed - not good news!
Watch 134 years of Global Warming
The next image is a fast-paced 135 year time-lapse reconstruction of the temperatures around the globe from 1880 to 2014 demonstrating the warming trends and some of the variations. This is called global warming. Not all locations on Earth experience the same degree of warming. The Arctic, for example is heating up much faster than the tropics. In some places the effects include drought or flooding and increased severity of storms because of the increased amount of water vapour in the air (warmer air can hold more water). Changes caused by global warming are also called climate change.
NASA: The average annual ebb and flow of Carbon Dioxide
Earth’s oceans and land cover are doing us a favor. As people burn fossil fuels and clear forests, only half of the carbon dioxide released stays in the atmosphere, warming and altering Earth’s climate. The other half is removed from the air by the planet’s vegetation ecosystems and oceans.
Terrestrial plants — from towering Douglas firs to moss growing on rocks — take up carbon dioxide from the atmosphere during photosynthesis, processing it into carbon-containing leaves, stems, branches and more.
"The land helps to mitigate something like a quarter of the carbon dioxide emissions," said Jeffrey Masek, chief of the biospheric sciences laboratory at NASA Goddard. "The question is: What will happen in the future? Can we count on this to continue? Or are land processes going to saturate, in which case we’d see our atmospheric carbon dioxide concentration start to increase much more rapidly."
Ocean scientists are facing similar questions about carbon. The ocean water itself absorbs carbon dioxide from fossil fuel emissions. Doing so, however, changes the chemistry of seawater. As surface water in the ocean continues to warm, uptake of carbon dioxide will slow down.
Ice Ages and Interglacials
Global climate changes (warming and cooling) are natural events in our planet’s past history. There have been times when the planet was much cooler - during the ice ages - and times when it was much warming - during the “interglacial periods.” The world is in an interglacial warm period today and has been for approximately 12,000 years.
An ice age is brought on by a complex set of factors dominated by small cyclical changes in the Earth’s spin axis (e.g., a wobble over thousands of years similar to a child’s spinning top; but at a much slower rate of change). As well, gradual cyclical changes in the orbit of the Earth around the Sun result in cycles of increasing and decreasing energy received at Earth from the Sun. These interactions combine over a full cycle of the longest period change that is approximately 100,000 years. This corresponds roughly to the time between the peak of an ice age (i.e., maximum extent) and the peak of the interglacial period (i.e., lowest extent of ice) between ice ages. Collectively, these variations are referred to as the Milankovitch Cycles. These are covered in more detail here
This repeating cycle can be seen in data derived from an Antarctic ice core, such as that shown below. The exhibit illustrates the last four glacial-interglacial cycles covering the past 450,000 years. Note that the end of a glacial period is rapid compared to the time it takes to build continental size ice sheets as the Earth slips into cooling periods. Consequently, the curve is a saw-toothed shape with a peak-to-trough of approximately 100,000 years as observed in the ice. The present interglacial was on a path indicating cooling temperatures. The cooling does not seem to be happening. Why? The answer can be found in other data, data derived from more recent times and related to anthropogenic impacts on climate. In other words, we are currently warming when in fact nature should see us currently cooling.
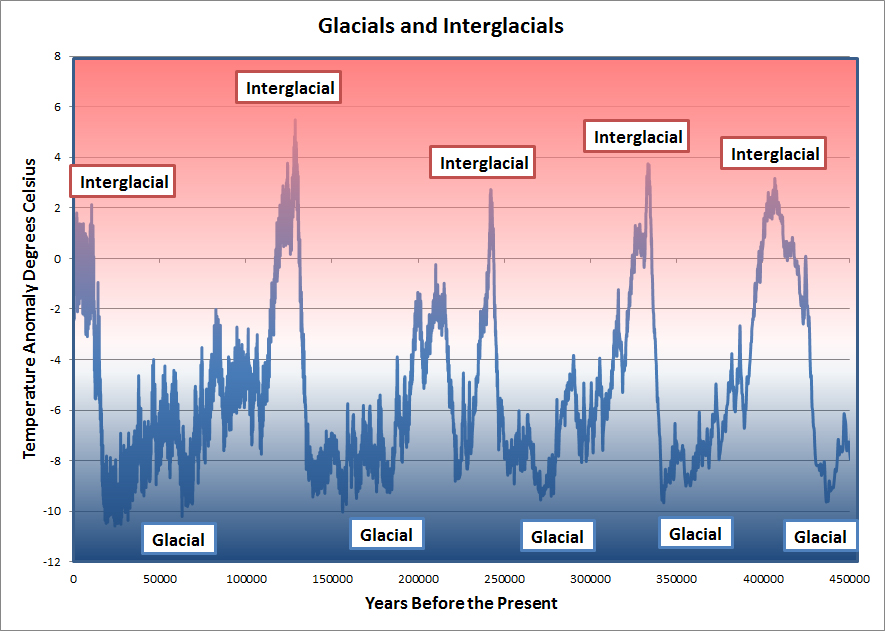
Data from Dome C Antarctic Ice Cores
Let's examine the interglacial period at 125,000 years ago in a bit more detail because it looks like the temperature suddenly reaches a peak and just as suddenly drops. Is this real? Instead of looking at all 450,000 years, let's just look at 30,000 years and see how sharp the peak is.
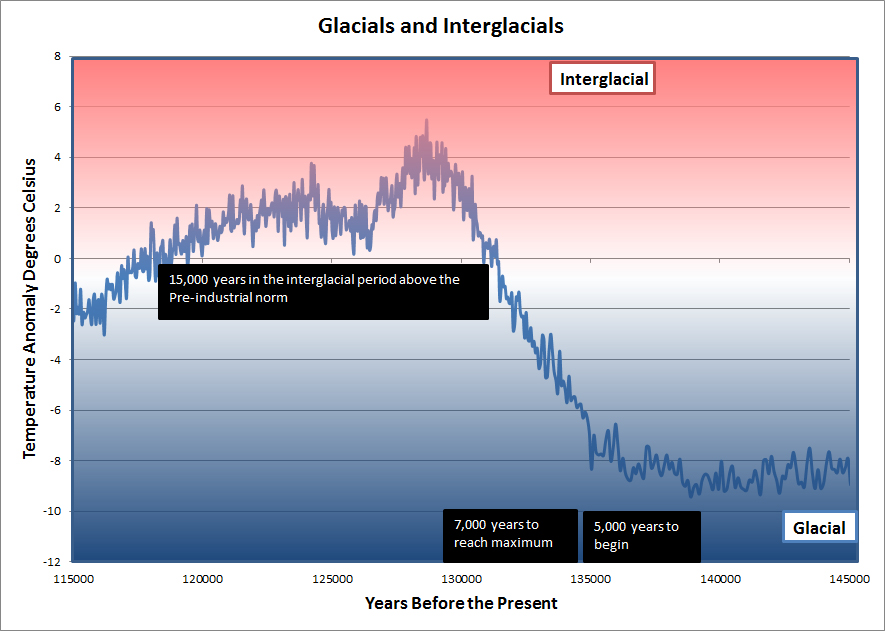
As you can see it is really quite gentle. It takes 5,000 years for the temperature to begin to climb after the ice age, 7,000 more years to reach a peak, and that sharp peak is really 15,000 years long.
Now, let's look just at the period as the temperature peaks and drops.
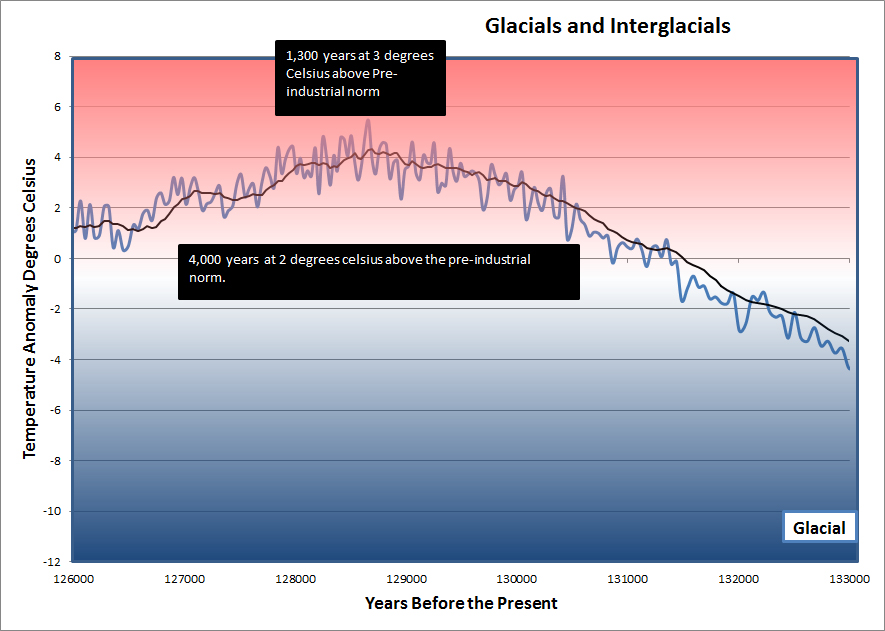
Now the sharp peak appears as a gentle rise in temperature that is maintained well above the pre-industrial norm for over 4,000 years. If you examine the curve, you will see lots of ups and downs in temperature with a clear trend that marks what we first saw as a sharp peak.
Let's look next at the very tip of the peak
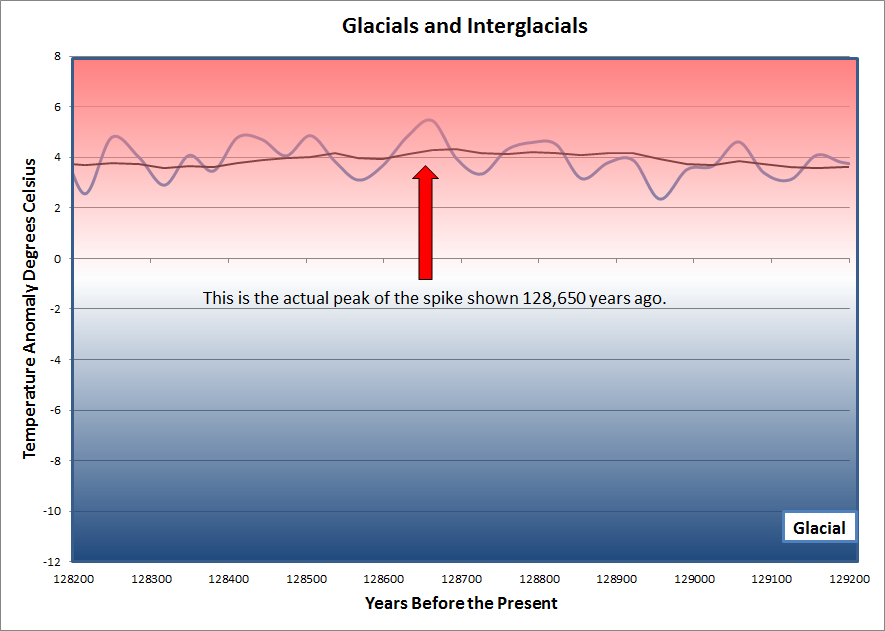
Finally, if we look at only a period of about 1,000 years (equivalent from the time when Leif Erikson first discovered North America until today), we see that the sharp peak is really a period of minor change in temperature (perhaps about 0.30C in temperature on average over the entire 1,000 years. That is less than half of what we have experienced in the last 1,000 years of our present climate change. Just for fun, that peak probably occurred just about 128,650 years ago (the year 126,633BC).
Natural Vs Anthropogenic Global Warming
Anthropogenic Global Warming is Not Natural Global Warming
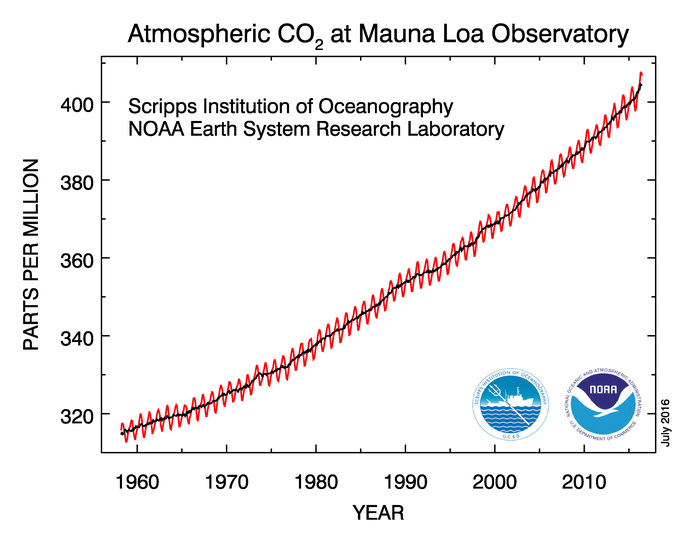
In recent times, there has been a rise in temperature. However, that rising temperature is not caused by the same factors that normally change the Earth’s temperature from cold to warm. This is a very dangerous discovery because the normal warming factors are not present today. Instead it is because of the rapid increases in carbon dioxide (CO2) from the use of fossil fuels. The CO2 concentration has risen from approximately 300 parts per million (ppm) since the 1880s to about 405 ppm today (July 2016).
El Nino and La Nina Effects are Short-Term
The temperature has risen as well, but not as steadily as the CO2 because the Earth is a complex place and the combination of weather and long-term global trends (climate) cause large variations in the rising temperature. One particularly important variable in short term changes in temperature is the occurrence of el Nino or la Nina events. These move vast amounts of water around and have a direct effect of global temperature, although they only last for one to five years. In this graph the orange bars indicate the warming effect of el Ninos and the blue bars indicate the cooling effect of the la Nina effects. The temperature anomaly in this graph is sea surface temperature.
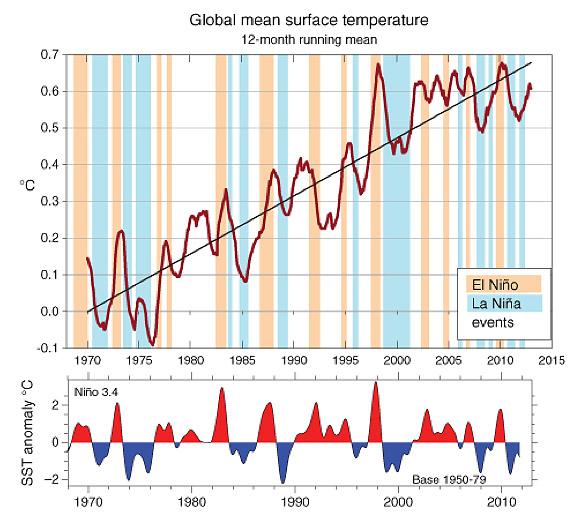
By the way, when you are looking at graphs of the temperature in global warming discussions, you will notice that there are several different “starting points.” In the first chart, the starting point was 1860 - normally considered about when the major effects of the Industrial Age began to take effect. The temperatures are given as “anomalies.” In these graphs the temperatures are the difference between the average of a given period in comparison to the current year. In the chart showing the el Nino effects, the period chosen as average was from 1950 to 1979. Another standard is the period from 1951 to 1980. These are usually 30 year periods, because that is the shortest length of time that climate change trends can be accurately calculated.
A Short, Long History of Climate Change
This cartoonist has many interesting cartoons commenting on modern life. His website is here: http://xkcd.com/1732/
