Fossil Fuel Emissions, CO2, Temperature, and Sea Level Rise
What is the connection between CO2 and global temperature changes? Does the amount of carbon emissions tally with the CO2 left in the atmosphere? Explore the graphs and find out. Let's start with determining if the human CO2 from fossil fuel emissions and other sources lines up with the actual accumulation of CO2 in the air.
When the two lines are almost identical in shape then the relationship is probably very close. The most important next step is to ask if there is a reason why they should be correlated. In this case it is obviously because the carbon added to the air in the form of CO2 from fossil fuel emissions is clearly responsible for the added CO2 in the atmosphere.
According to the theory of recent global warming, the most important greenhouse gas that we are adding to the atmosphere is CO2 and that causes the temperature to rise in the atmosphere and ocean by capturing and re-emitting infra-red radiation (heat) that is rising from the planet's surface. If that is true the average global temperature should be rising with the added CO2. On an annual basis the temperature is very changeable from one year to the next, but the trend should follow the trend of increasing CO2.

Another part of the theory of global warming is that the sea level should go up as the ocean warms. It goes up for two main reasons. First as the water warms up it expands, and second as the world warms up the ice that is sitting on the land melts and drains into the ocean raising the sea level. If that part of the theory is correct, then the increasing temperature should cause the sea level to rise more-or-less in synchrony with the temperature.

As you can see from the graph, the sea level is going up more steadily than the air is warming up. They both are quite variable from year to year but the air is the most variable. This is partly because the ocean absorbs most of the heat but water takes a lot of heating before it warms up much and then it is also slow to cool down. So that is why the ocean temperatures do not fluctuate the same amount as the air does. However, the overall trend for the ocean and air temperature to rise together.
One more thing we can expect if the theory is correct, is that the sea level and the CO2 should also rise in a more-or-less synchronous fashion - because the CO2 is what is causing the temperatue to rise, which in turn is causing the ocean to warm up and that is causing the sea level to rise.

This next relationship may be a bit surprising. If we plot the annual variation (not the actual increase in temperature, but just the variation from year to year) we will see that there is something strange happening. The variation remains the same no matter what the overall average temperature does. In other words the temperature increase just makes the whole climate warmer but doesn't change the way the weather works. Each year can be just as different from one year to the next as it was before the temperature increased.

So as you can see, the wiggles along the horizontal are the year to year variation (the weather). The gradual trend to a warmer temperature is the changing climate. It is logical that if the annual temperature increments are not affected by the increasing temperature, the the sea level rise should also be affected only by the increasing trend of temperature, not by the annual temperature increments. We can find out by comparing the annual temperature increments against the overall sea level rise.

Sure enough, the annual variaton of temperatrue does not appeqar to have an effec on the overall trend of sea level rise.
We already have seen the increasing CO2 lines up with both the increasing temperature and the rising sea level. But we also can see that the annual variation in temperature is unaffected by the increasing temperature and also we can see that it has no effect on the rising sea level.
We could also ask if emitting larger and larger amounts of CO2 into the air has any influence on the year to year variation (the weather). We can do this by comparing the annual variation in CO2 increase with the annual variation in the temperature.
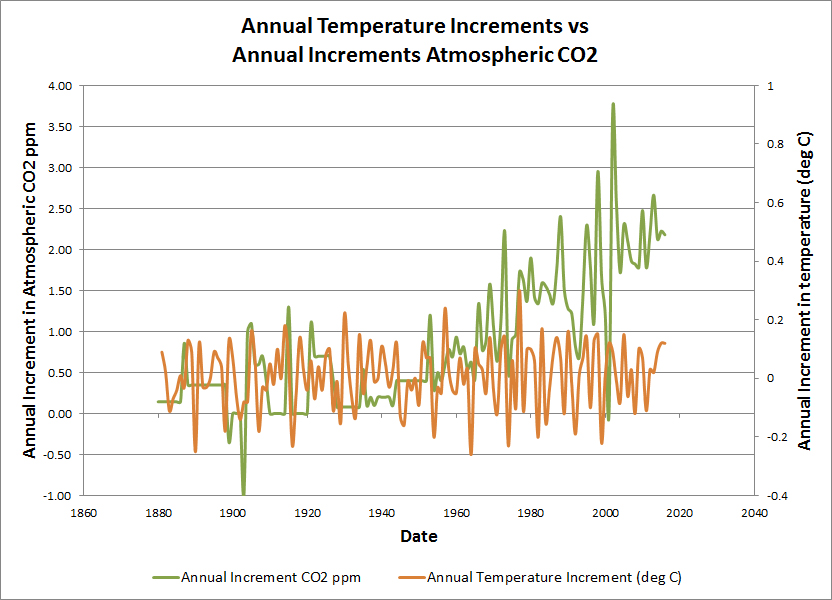
From the graph, we can see that there is no correlation based on trend. The temperature increments don't increase with the increasing CO2 increments. It is tempting to see if we can find similar peaks and vallys. There are a few where they line up, but it is not consistent, so there is no correlation there either.
Given that the increasing annual increments of CO2 do not affect the annual increments of temperature, we should check to see if the increasing annual increments of CO2 affect the annual increments of sea level rise.

Looking at the graph there are some odd things happening. The variation in sea level on an annual basis looks like it suddenly was much less after about 1880. We could ask if this was due to the increasing CO2 level or was it developing a more accurate method of measuring sea level? Using tide guages has some potential errors because in some places in the world, the land is sinking, while in others it is rising. These are due to geological changes or rebounding from the released pressure of ancient glaciers during the ice ages. That could explain part of the difference. Once satellite measurements were possible, the sea leel is measured against the known altitude of the satellite, so that automatically corrects for sinking or rising land.
We still have one more test we can try by comparing the annual increments of sea level with the annual increments of temperature. It is important to remember that both the sea level and the temperature are rising together, but we are going to compare just the annual variation or increments on a year by year basis.

In this graph we can see that the two do not rise or fall as a trend - they are both varying around their own zero change line. It is tempting again to see if the peaks and valleys line up. That would make a bit of sense in that the sea level could be sensitive to annual shifts as the temperature moves up and down. The most accurate measurements are all after about 1960, so we can examine that in a bit more detail.

To make the comparison easier, I shifted the two lines so they overlap. If you follow the red line - temperature increments - it is the variable that would be the "cause" and the if there is any "effect," that would be seen in the blue line - the sea level change. At first the red line and the blue line match, but by the late 1960's they go in opposite directions. They don't match again until about 1985. They stay together for another five years but then they get out of synch, and don't really get back together until vaguely in the mid-1990's and finally converge again about 2010 - so it is safe to conclude that there is no year-to-year effect of annual temperature change on annual sea level change. Any apparent cause and effect is probably coincidental, not real.
So while there is no real effect from the annual variations in temperature on sea level rise nor is there any effect from CO2 increments on annual temperature variations, the story is quite different when we look at the trends. The increasing amounts of CO2 line up with the rising temperature trend which in turn lines up with the rising sea levels.
If we put all this together, what we see is that the annual changes from year to year in both temperature and sea level rise are due to local and short-term effects, whereas the long term CO2 increase has caused a long term incease in the temperatures at which the sme amount of variaiton takes place.
This next graph is a "depiction" of what is already happening and what will happen as the global average temperature rises in response to the rising CO2 levels.
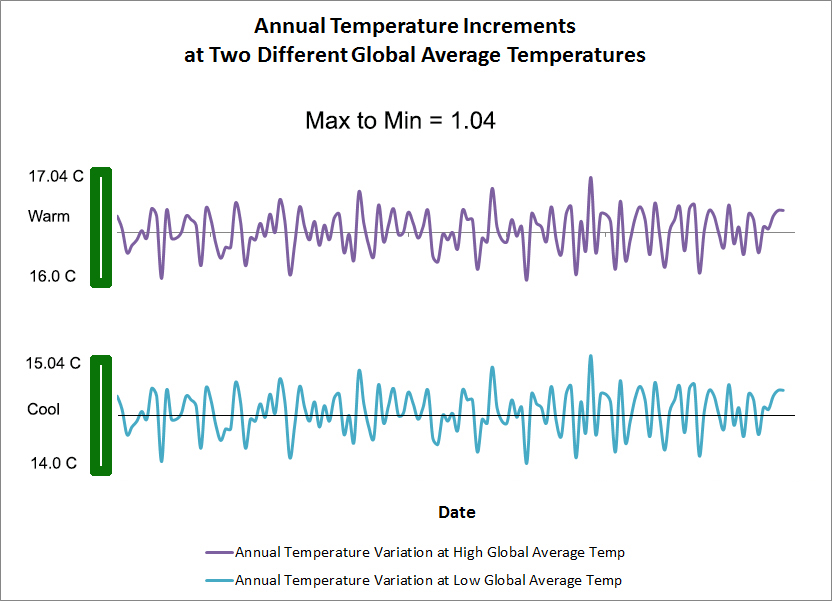
What does that chart actually mean? The temperature differences from year to year will remain more-or-less the same, but the average temperature will be warmer as the climate warms up. Does this really matter? Suppose you live in an area where the water freezes fairly often in the winter. As the climate warms up, you will see fewer and fewer days where the water freezes. If you live in a warm area the number of scorching hot days will increase, even though there will still be some cool days.