
The Meaning of Words
Glossary of Terms
Observations:
For climate change, "observations" include temperature, temperature changes, circulation patterns of atmosphere and ocean, energy input from sun, energy losses, back radiation, energy distribution, changes in atmospheric and ocean chemistry, and heat content, etc.
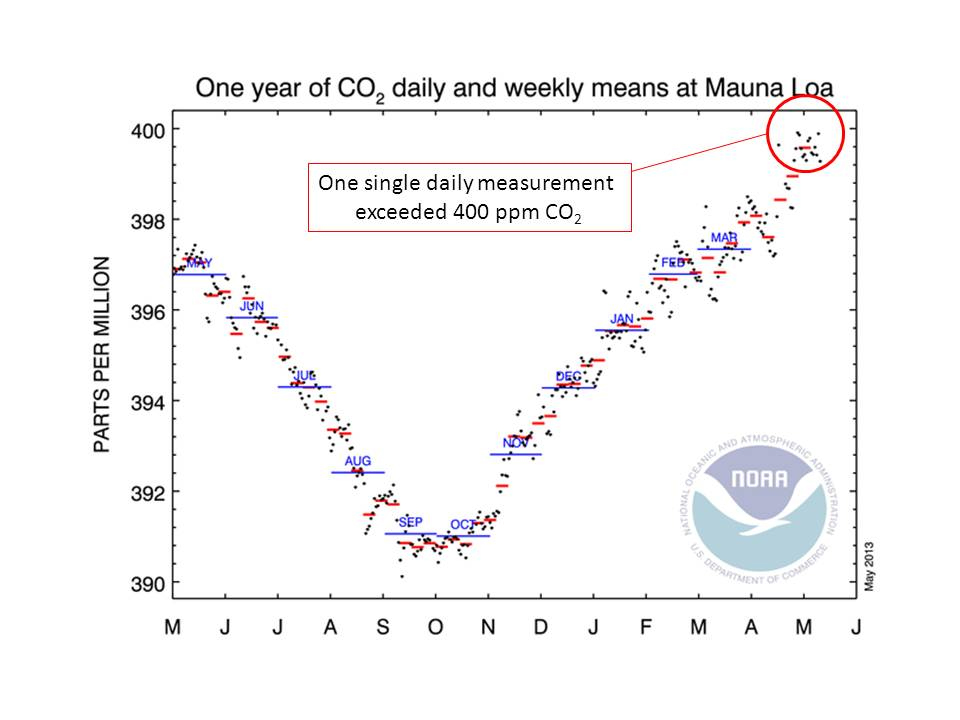
DATA.
Any series of observations or measurements that are used to create descriptions of trends, relationships, models, cause and effect relationships, or test hypotheses. This example is a series of CO2 atmospheric concentration data from the Mauna Loa observatory shown plotted over one year. The dots represent each data point.

TRENDS.
Changes over time, changes with depth or height, etc. demonstrated with trend lines to smooth out the variations. The line joining all the dots shows the trends in detail. Some sets of observations have very large ranges of variation that can hide or confuse the trend over time. To ease interpretation, various mechanisms are used to calculate the trends by smoothing out the variations. In thiscase the line in the middle shows the trend of the average daily concentration of CO2 over time.
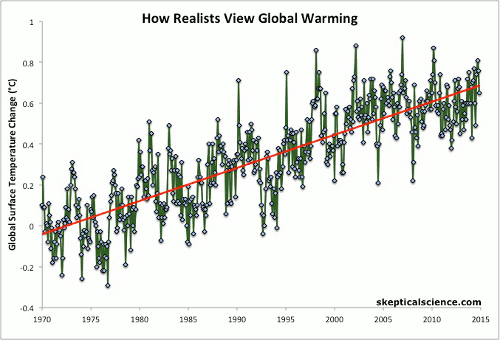
This is not the same as choosing one start point and one end point and ignoring all the information in between. The example here is the trend for temperature to rise over time. There is a great deal of variation, so choosing a start and end point could lead to a mistaken interpretation. Instead a process of averaging is used to reveal the true trend.
CORRELATIONS
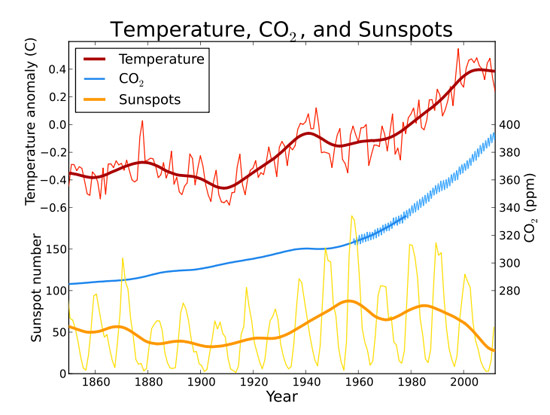
Matching or opposite trends. This example is comparing the upward trend of temperature to the upward trend of CO2 and the downward trend of solar energy. The graph shows the temperature wobbling generally upward. The changes in solar intensity are wobbling downward so that is not raising the temperature. CO2 is rising smoothly upward in approximate synch with the temperature. This indicates CO2 is responsible for some of the temperature changes including the upward trend.
MODELS.
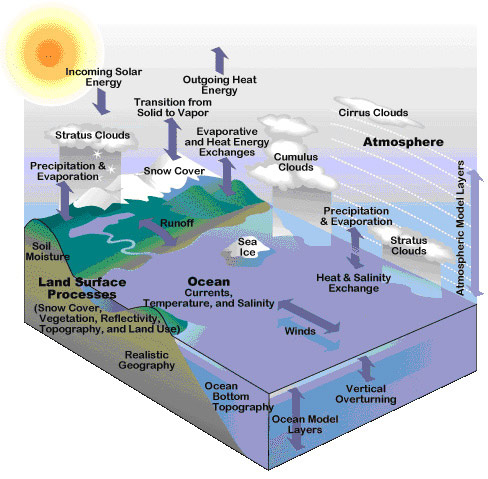
A scientific model is a representation of the real world, usually very simplified so it is easier to figure out how things work. Sometimes the models are visual and sometimes they are mathematical. This is a visual model of climate energy budget. The transfer and distribution of energy from the sun is depicted as arrows.
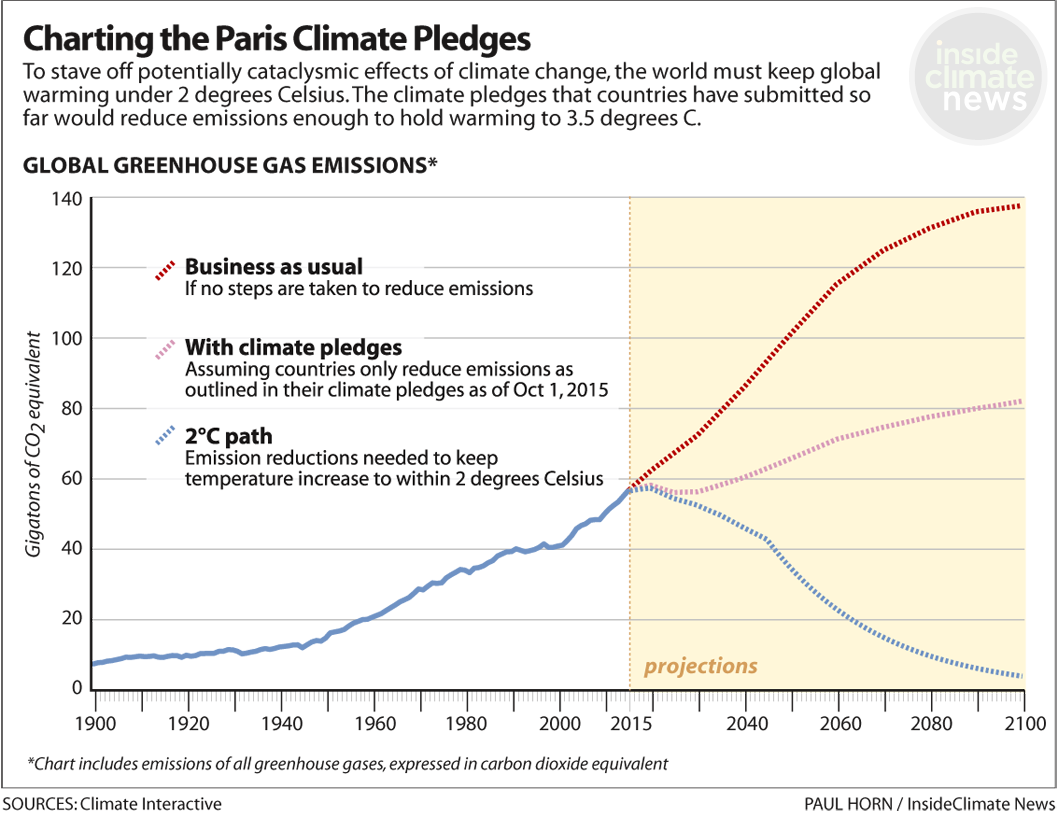
PREDICTIONS OR PROJECTIONS.
The models used in the supercomputers translate the models into mathematical equations to make predictions such as average temperatures in the sea surface for a given set of conditions. Predictions are made when the full set of conditions are known (such as in a lab setting). Projections are made when the final conditions are not known but can be set up as a series of "what if" scenarios. For example what if everyone stopped using fossil fuels, or what if everyone just carries on as usual and uses as much fossil fuel as they want.
CAUSE AND EFFECT
Once a strong correlation is observed, we need to see if there is a reason why the changes we see are actually cause and effect of if they are just coincidence. For example, we see that temperature and CO2 rise together. Is that a fluke or is there an underlying reason? Which is the cause and which is the effect?
Most people use this term to mean a guess or hunch. In science the term means a description that still needs some testing of why or how something happens (such as increased CO2 causes temperature to increase by absorbing infrared radiation back scattering from the planet).
THEORY
A scientific theory is an explanation of how or why something happens that has been tested thoroughly, improved and tweaked until it completely explains the mechanism behind the event or correlation.
TESTABLE HYPOTHESIS
Statement that describe a unique condition or observation or event that is a necessary consequence of a theory or of the proposed cause and effect relationships. This makes it possible to test the theory or hypothesis for true or false results. An extension of the correlation is not a good test.
Let’s use the theory that CO2 causes temperature increase as an example of how to create a testable hypothesis to test the theory that CO2 is the cause of the temperature rise.
1) If CO2 is the cause of global warming the stratosphere (upper atmosphere) must be cooling while the troposphere (lower atmosphere) is warming.
2) If the sun is the cause of the warming both the troposphere and the stratosphere would be warming together.
So the test is a true or false choice to check and see if the two areas of the atmosphere are rising in temperature together or in opposite directions. In this example the stratosphere is cooling while the troposphere is warming.
EVIDENCE
Data or correlations that provide the information on which a statement or test is based.
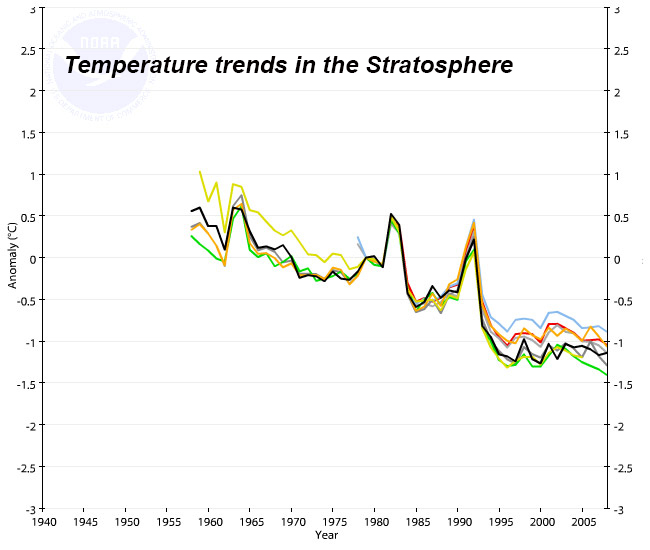
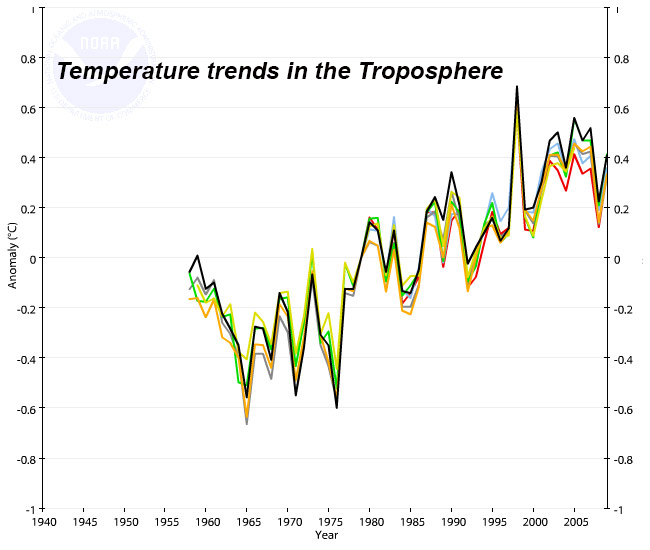
Test # 1) CO2 is the cause of warming: not false.
Test # 2) The sun is the cause of the warming: false.
CONFIDENCE LIMITS
In science, the amount of the variation that is explained by a trend line through the data set in a correlation is usually expressed as a percent statement such as 50% of the variation in the data set is explained with 95% confidence. This basically means don’t be surprised if half the variation spills outside the lines defining the range of variation about once every 20 times.