Back to the Solutions
URANIUM AND THORIUM PART #2
FINANCIALS
Introduction
Assuming Uranium or Thorium power is an infrastructure project, it is important to understand the relative cost of investing in these power plants as opposed to fossil fuels and renewables. The following information is drawn from a wide array of sources all of which are in the public domain.
The choice therefore is a simple one. Do we think we can afford the cost of saving humanity? Or is it too expensive, so we will not worry about the future of people we will never know.
This paper investigates the scale and cost of implementing a 50 year transition project to reduce CO2 emissions to zero, and then continues the project to remove enough CO2 from the atmosphere to bring the atmospheric concentration down to 280ppm – the level of CO2 that was the pre-industrial baseline and that will hold the temperature and sea level rise to a minimum increase. We will also need to control methane and N2O from agricultural and forestry practices.
The decisions we take in the present and near future have an irrevocable impact on future generations and we have the power to manage those distant effects. The longer we wait, the greater the impact and the less control we can exert. By contrast, if we immediately implement aggressive measures to transition quickly away from fossil fuels and to reduce the atmospheric CO2 concentrations to about 280ppm as soon as possible, there is an excellent opportunity to reduce the locked-in distant impacts to manageable risks for our descendants of temperature increase, sea level rise, and all the concomitant interdependent effects. By acting to investing the needed infrastructure there is a large profit to be made from this project.
Therefore a project to bring CO2 levels in the atmosphere down to a level where the climate will stabilize and deliver a benign set of climatic conditions is a requirement for human survival, but not a long-term economic burden.
The Scale of the Transition Project
The most important aspect of gaining control of the warming climate trend is to move from fossil fuels to carbon-free or carbon-neutral forms of energy as well as to improve land-use, agricultural, forestry, and wetland management practices. Energy sources are basically wind, solar, water, nuclear, and the needed storage devices if nuclear is not implemented.
Global consumption of energy has increased steadily for many years, and since the late 1990s has been on a straight line increase that is expected to continue without slowing down until at least 2040 and beyond. The main regions of increase are non-OECD areas of the world. By contrast the OECD countries have stabilized at less than 300 quadrillion BTUs per year (Chart #1).

World energy consumption for OECDE and Non-OECD countries. http://www.eia.gov/outlooks/ieo/world.cfm
Over the course of the next 50 years, the projected increase in energy use will be linear, as it has been for the past nearly 50 years. That projection estimates the total annual energy consumption in 2066 to be about 1359 quadrillion BTUs annually. This global energy consumption includes all heating, electrical production, and transportation.
For the most part, all the different sources of energy have increased. Natural gas has increased more rapidly as fracking operations make it much easier and cheaper to extract. The two exceptions are first, coal, which has slowed to a steady pace of increase, and nuclear which has slowed down considerably although it has not stopped increasing yet (Chart #2).
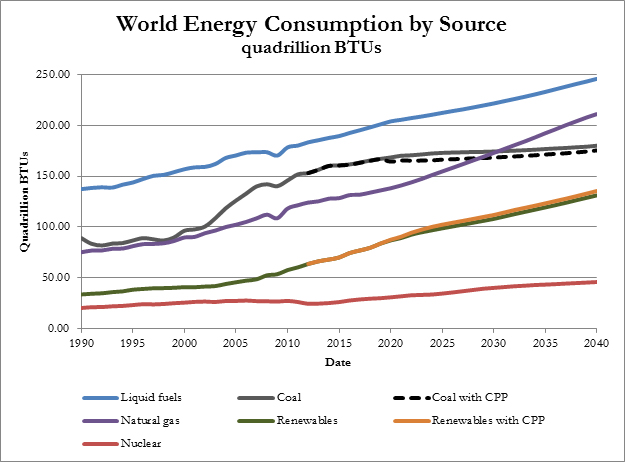
The projected global consumption by source to 2040 courtesy of the International Energy Association.
To contemplate re-tooling all the global energy consumed within 50 years is a project of a scale that has never previously been undertaken, but equally it is a project that must be undertaken because it will make the difference between human survival and extinction.
The Energy Sources and Costs
There are many potential sources of carbon-free or carbon-neutral energy production (Table #1). Water-based energy is limited by location. Wave and tidal power necessarily involves the ocean, conventional hydro uses running water in large volumes so demands a river source. It is possible to use excess power to pump water from a lower level to a higher level to be used in periods when peak power is required or when intermittent power needs back-up. Similarly some locations favour wind or solar more than others. These three (wind, water, and solar) are sometimes referred to as “renewables.” Wind and solar energy sources are especially prone to intermittent power production; solar because sunshine is limited to about half the time and wind because the changing weather conditions define when the power can be delivered.
Each of the various sources has a typical cost to build. Financing and delays are typically part of most projects. Because those are unpredictable and not part of the actual construction costs, an arbitrary measure of construction costs is used to remove those unpredictable costs but to retain the accuracy of costs of construction. This is called the “Overnight Cost” suggesting that the entire construction took place in one day and night.
Table #1. Energy Sources and Overnight Costs.
|
|
|
|
|||
| Energy Source |
|
|
|
|
|
| Hydro Conventional |
|
|
|
|
|
| Dual Unit Nuclear |
|
|
|
|
|
| Natural Gas Advanced CC with CCS |
|
|
|
|
|
| Onshore Wind |
|
|
|
|
|
| Coal Dual Unit with CSS |
|
|
|
|
|
| Coal Single Unit with CCS |
|
|
|
|
|
| Natural Gas Single Unit IGCC with CCS |
|
|
|
|
|
| Geothermal Binary |
|
|
|
||
| Fuel Cells |
|
|
|
|
|
| Solar Thermal |
|
|
|
|
|
| Photovoltaic (large) |
|
|
|
|
|
| Biomass BFB |
|
|
|
|
|
| Photovoltaic (small) |
|
|
|
|
|
| Offshore Wind |
|
|
|
|
|
| Geothermal Dual Flash |
|
|
|
|
|
| Municipal Solid Waste |
|
|
|
|
|
| Biomass CC |
|
|
|
|
All of the sources listed here are either carbon-free, or carbon-neutral once operational. Each source also has limits to its capacity to produce power continuously. Some have to be shut down for maintenance on a periodic basis. That maintenance is known to consume a certain amount of time in which the plant cannot produce power. For solar, wind, and water, the variation in output is dependent on the weather or the sunlight. Each of these variations is calculated as a percentage of what would be 100% output. In addition, each plant has a different lifespan. Some are very long, such as nuclear power and pumped storage. Others such as wind which has many moving mechanical parts must be replaced approximately every 20 years.
In a long-term project such as the transition project we recommend, the capacity factor and the lifespan need to be factored into the cost during that 50 year period. When capacity factor and lifespan are included in the estimate of overnight costs over a 50 year period, the relative cost structure shifts dramatically.
In addition to construction costs, once the facilities are operational, the costs of regular maintenance and operations such as fuels costs must be included. All of these considerations will increase the final costs – we did not attempt an assessment of these increased costs.
Estimating the Cost of the Transition Project
Phase 1. Zero Emissions
Jacobsen et al. have established their estimate of a distribution of energy sources relying solely on solar, wind, and water. For our project, we assume that the total energy needs will be supplied entirely through a similar distribution of energy emphasis as that used by Jacobson et al., but scaled up to deliver all that is needed within a 50 year period. This essentially assumes the energy supplied can be used to create synthetic carbon-neutral fuels or to charge storage devices. The proportions Jacobson et al. propose for global amounts are: 1) wave and tidal = 0.8%, 2) offshore wind = 12.9%, 3) onshore wind = 19.4%, 4) utility scale solar = 49.8%, 5) rooftop solar = 11.5%, 6) hydro = 4.8%, and 7) geothermal = 0.7%.
Jacobson omits nuclear energy. However, nuclear is actually one of the safest energy sources with a low adjusted overnight capital cost because the nuclear plants have such a long life span and can operate almost continuously, unlike all of the energy sources chosen by Jacobson.
The total energy that is required by the end of the 50 year project is 31.6TW.
To estimate the total cost of the 50 year project, we made two estimates. The first used the percentage emphasis from Jacobsen et al. multiplied by the adjusted overnight cost for each source. By adding the cost based on emphasis for each source, we found the total adjusted overnight cost. The second estimate is based on using 60% nuclear with an appropriately adjusted residual (lowered proportionally) emphasis from that proposed by Jacobson et al. (Table #2).
Table 2A and 2B. The comparative adjusted overnight costs using all renewables compared to a combination of nuclear and renewables.
|
|
adjusted capital cost (capacity factor, lifespan) |
% Emphasis Jacobson Global |
Jacobson Total Overnight Cost |
| Hydro Conventional |
|
|
|
| Dual Unit Nuclear |
|
|
|
| Onshore Wind |
|
|
|
| Geothermal Binary |
|
|
|
| Solar Thermal |
|
|
|
| Photovoltaic (large) |
|
|
|
| Photovoltaic (small) |
|
|
|
| Offshore Wind |
|
|
|
| Geothermal Dual Flash |
|
|
|
| Biomass CC |
|
|
|
|
|
|
|
|
|
|
adjusted capital cost (capacity factor, lifespan) |
Nuclear Mixed Global % emphasis |
Nuclear Mixed Overnight Cost |
| Hydro Conventional |
|
|
|
| Dual Unit Nuclear |
|
|
|
| Onshore Wind |
|
|
|
| Geothermal Binary |
|
|
|
| Solar Thermal |
|
|
|
| Photovoltaic (large) |
|
|
|
| Photovoltaic (small) |
|
|
|
| Offshore Wind |
|
|
|
| Geothermal Dual Flash |
|
|
|
| Biomass CC |
|
|
|
|
|
|
|
|
The cost comparison suggests that nuclear in combination with renewables is much cheaper. From a practical operational standpoint having nuclear as the base load also makes sense because nuclear power is most competitive when it operates more than 5,000 hours per year, a result of the high initial capital costs. Typically nuclear plants do not follow load, although the modern nuclear plants can and CANDU nuclear plants can adjust very quickly to load changes. Instead, we propose that nuclear energy parks be established where nuclear plants produce both elecricity and also synthetic carbon-neutral oil and gas low demand to be used as storage back up for the intermittency of renewables or to be used as a saleable carbon neutral fuel to replace the fossil fuels.

The total amount of energy required is approximately 32 TW total annually by 2066. Thus, the requirement is to build almost that much capacity within 50 years, assuming that almost all of that energy is currently supplied with fossil fuels or outdated nuclear facilities.
For the model we used based on the Jacobson emphasis, the total cost will be $477 trillion. The annual cost of construction – assuming the scale up is possible – will be spread over 50 years will be approximately $9.6 trillion per year.
For the combined nuclear and renewables, the total cost is $244.4 trillion. Once again the cost will be spread over 50 years so the annual cost of construction will be $4.9 trillion.
This cost seems astronomical at first glance, but the cost for the combined nuclear and renewables is roughly equal to the IMF estimate of subsidies for fossil fuels ($5.3 trillion per year). Many of these subsidies are derived from underestimating the cost of cleanup and reparations for pollution. Thus, instituting a price of some type for carbon would be necessary to free up all of these subsidies. A global decision to award those subsidies only for the construction of transition project energy sources would solve the financial problem and keep the fossil fuel companies operational while completing the transition. The approximate global GDP is $120 trillion, so the project to save humanity would cost approximately 4.1% of global GDP per year for 50 years. If the choice was to go entirely with renewables, the cost would approximately double to about 8% of global GDP per year for 50 years. (The percentage of GDP estimates are based on the assumption that GDP remains proportionally the same in the future as it is today.)
In such an enormous project, economies of scale may well reduce the costs. In addition, the modern production of small modular nuclear reactors could be created on a factory basis, considerably reducing the costs of construction and improving the safety.
Finally, the operation of all of the energy production facilities will ultimately be based on revenue from users, whether through government facilities or by the private sector. Renewables return a profit on their investments within about 10 years and nuclear facilities within 15 to 20 years. Thus, in the longer term, the investment is a profitable venture.
The Benefits of Investing
There is a significant investment needed to save humanity. If we carry on as if the planet is an infinite resource with no need to manage our waste products, sooner or later, the mismanagement will catch up with us and lead to our extinction. A clear and present danger is the limiting factor of carbon sinks. We have overwhelmed their capacity to hold the temperature at a level that provides us with a benign and stable climate. The consequences of ignoring the increasing CO2 levels in the atmosphere are ultimately lethal to all humans.
Pollution reduction: Embarking on a management program to control and hold CO2 and other greenhouse gases levels at a level that will support civil society is an important task that the world has already begun. However, our research suggests the scale of the programs already begun is not sufficient to save humanity. The goal of this study is to outline the scale of the projects that will be required to undo over 300 years of producing excess CO2, nitrous oxide and methane above what the natural sinks can hold to keep our temperature at a baseline level equal to the pre-industrial era.
Reduce the number of climate refugees: Our population is very large and growing. We have huge investments and dependence on infrastructure that will be severely compromised in coastal areas, as well as associated impacts inland that will create literally billions of climate refugees, or worse, if the correct choices are not made.
Improvements to infrastructure: The long-run benefits of making enormous infrastructure investments offset the short-run costs. But to realize these benefits it is necessary to make the investments. For example, the current death toll from pollution and toxic waste as well as industrial accidents from using fossil fuels is estimated to be nearly half a billion people annually with as much as six times that resulting in illness of various types. Using renewables and nuclear power would largely eliminate the costs of these illnesses and deaths.
Job creation: Under most building projects, approximately 2/3rds of the cost is in people (jobs). These will be well-paid positions, because they require technical skills. Hypothetically, one might estimate each job would average $75,000 per year. If the combination of renewables and nuclear is chosen, ($4.9 trillion per year) the number of jobs created will be about 65 million jobs world-wide.
Individual energy installations are profitable: Transitioning to carbon-free or carbon-neutral energy sources encompasses a wide array of potentials. The four most popular include onshore and offshore wind, solar, and nuclear. Water is also popular but most of the potential locations are already in use. A simplified approach to judging profitability in energy sources is to calculate the cost of construction, the cost of delivering the energy compared to the market prices of power, and life span of the installation. In our case, the project to make the transition is 50 years. The lifespan of a nuclear installation is about 70 years so the earning power continues after the transition project is completed. The lifespan of wind and solar installations is about 20 to 25 years, so the last installation would also extend out to 70 years.
|
|
|
|
|
| Nuclear | $5,530 | $45 | $75 |
| Onshore Wind | $2,213 | $45 | $102 |
| Offshore Wind | $6,230 | $140 | $189 |
| Solar | $3,873 | $75 | $127 |
If we set the market price so offshore wind can be sustainable, then the relative profitability based on these numbers is a near tie between onshore wind and nuclear power with solar in second place, and offshore wind barely profitable (Chart #4).

Relative profitability based on a simplified assessment using Overnight Capital vs Levelized Cost of Energy. The actual numbers are hypothetical, but it does show a high profit potential, if the installations are efficient and if the price of energy is allowed to be set at market value.
On the other hand, instead of requiring each of the energy supply systems to deliver power 100% of the time, if we allow solar and wind to sell power only as they have it available and require nuclear to take the base load with all of the backup as well, then the efficiency of the energy supply system falls somewhat (because of the high variability of the solar and wind sources), but the the price to the customer can be lowered considerably.

According to the announcement of Tesla and Solar City, the intended installation of solar power with complete backup in batteries is contracted to deliver power to the utility at about $0.14/kwhr. In the analysis above, if the solar power is not required to have a backup system and can sell power to the utility as it acquires the energy, and if the nuclear power is required to act as both base load and backup, then power can be delivered to the utility at about $0.09/kwhr. In each case, after the end of the 60 year project, the ROI for both the nuclear and the solar are reasonable and neither facility is required to go into the red after it breaks even.
The fundamental message is that there is an acceptable mechanism to make the cost of initial investment reasonable and to develop a significant profit for investors in energy transition assuming nuclear is the foundation supply system with solar and wind available as intermittent sources. This could all be accomplished in the required 50 year period.